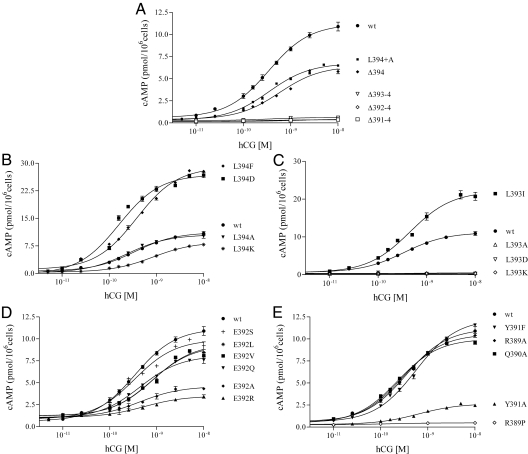
Fig. 5.
Dose-response isotherms of cAMP concentrations after hCG stimulation of LHR in the transfected s49 ck cell lines. All panels include data from LHR+/Gαs+ wild-type (wt) cells. A, Data from the CT Ala extension, L394+A, and the truncation mutations; B–E, data from the point mutations at positions −1 (394), −2 (393), −3 (392), and −4/−5/−6 (391/390/389), respectively. The results show mean ± sem; the numerical values are given in Table 1.

