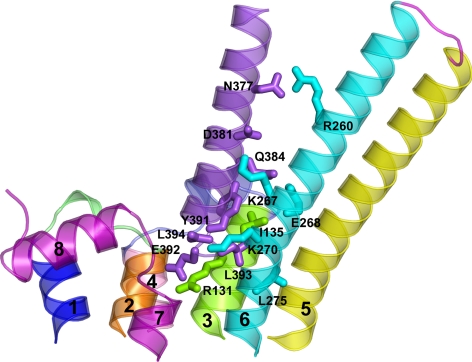
Fig. 8.
Complex between Gαs and an activated state of the β2-AR. The side view, in a direction parallel to the membrane plane, of the selected complex between the Gαs CT (violet) and the cytosolic half of the receptor is shown. The amino acid side chains involved in pairwise interactions are represented by sticks. Helices 1, 2, 3, 4, 5, 6, and 7 are blue, orange, green, pink, yellow, cyan, and purple, respectively (helix 8 is purple as well), whereas IL1, IL2, and IL3 are lime, slate, and magenta, respectively. As for Gαs, the numbering of the long form, employed in the in vitro experiments, is shown in this figure, although the structural model refers to the short variant. In this respect, the amino acids Y391, E392, L393, and L394 in the long form correspond, respectively, to Y377, E378, L379, and L380 in the structural model. Drawings were created with PyMOL 0.99rc6.

