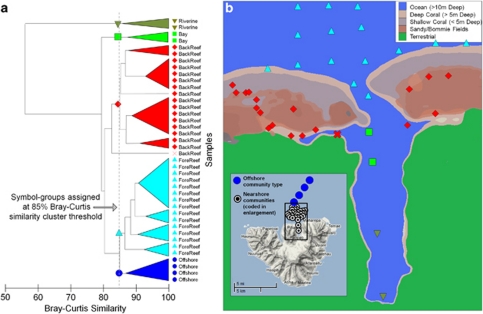
Figure 4.
Spatial distribution of bacterioplankton community types in the 2009 synoptic survey. Surface DNA samples are symbol/color coded according to five community types defined as 85% Bray–Curtis similarity group average (unweighted pair group method with arithmetic mean) clusters of 16S bacterial rRNA gene amplicon TRFLP fingerprints (a; vertical line demarks the 85% cluster threshold, triangles indicate samples without significant differences by SIMPROF bootstrapping). Samples are annotated in the dendrogram according to nominal sample habitats for clarity. The map (b) is loosely shaded according to depth and substrate type keyed at the upper right, with samples symbol-coded according to TRFLP cluster. The inset map in (b) shows community types found at the offshore sampling locations, which were within ∼6 km of Moorea in >200 m deep water. A color reproduction of this figure is available on the html full text version of the manuscript.

