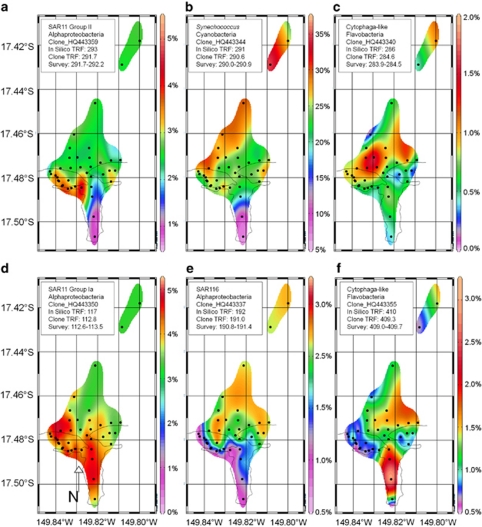
Figure 5.
Spatial distribution of bacterial phylotypes in the vicinity of Paopao Bay 1 September 2009. Each plot shows shaded contours of the relative abundance of terminal restriction fragments (TRFs), which were putatively identified with a cloned sequence from Moorea (Supplementary Figure S5). Each phylotype distribution displayed here is unambiguously represented by a cloned sequence with a measured TRF falling within the 1 bp range of environmental TRFs and for which the closest matching full-length clone in the greengenes database (DeSantis et al. 2006a, 2006b) has an identical in silico TRF and taxonomic classification, with the exception of SAR11 group Ia which has an established consistent disparity between in silico TRF lengths (117 bp) and clone TRF lengths (113 bp) as shown by Morris et al. (2005). Note that SAR11 clades are relatively enriched in the backreef (a, d), whereas Cytophaga and SAR116 are relatively depleted (c, e, f). Synechococcus, SAR116 and SAR11 group II are relatively depleted within the bay and increase offshore (b, e, a), whereas the two Flavobacteria are enriched in the forereef (c) and bay (f), respectively.

