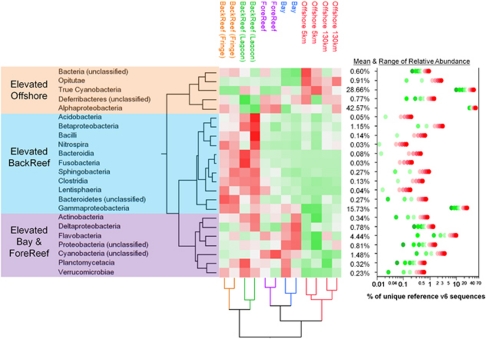
Figure 6.
Spatial variability in relative abundance of bacterial classes derived from pyrosequencing of environmental 16S rRNA V6 amplicons sampled in the vicinity of Moorea 11–13 January 2008. Replicate samples are labeled (top) according to collection location (see Supplementary Table S1) and clustered (bottom) by relative abundance of sequences matching reference OTUs aggregated by class (cluster lines are colored the same when there is no significant difference in communities; SIMPROF P>0.05). Classes are clustered (left) according to relative variance across the spatial gradient, with green below average and red above average. Mean and ranges of relative abundance of each class across the dataset are given at right with color codes matching the heat map. Clustering and heatmaps were generated in the JMP v8 statistical package using group average clustering of samples according to class relative abundances between samples.

