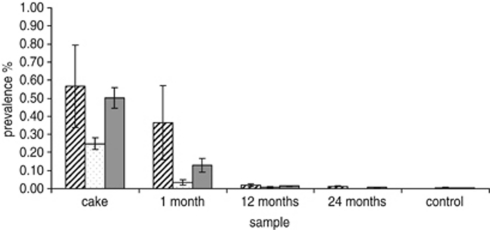
Figure 2.
Gene prevalence in total bacterial population from limed, dewatered sewage sludge (cake), agricultural soil 1, 12 and 24 months after cake application. Control samples were taken from an area adjacent to the agricultural amended plots, which had not received sludge. Diagonal lines, intI1; stippled bars, qacEΔ1; grey bars qacE. Error bars are s.d. of three biological replicates for cake and 10 for amended soils, each composed of three technical replicates. All intI1 prevalences are statistically different from one another.

