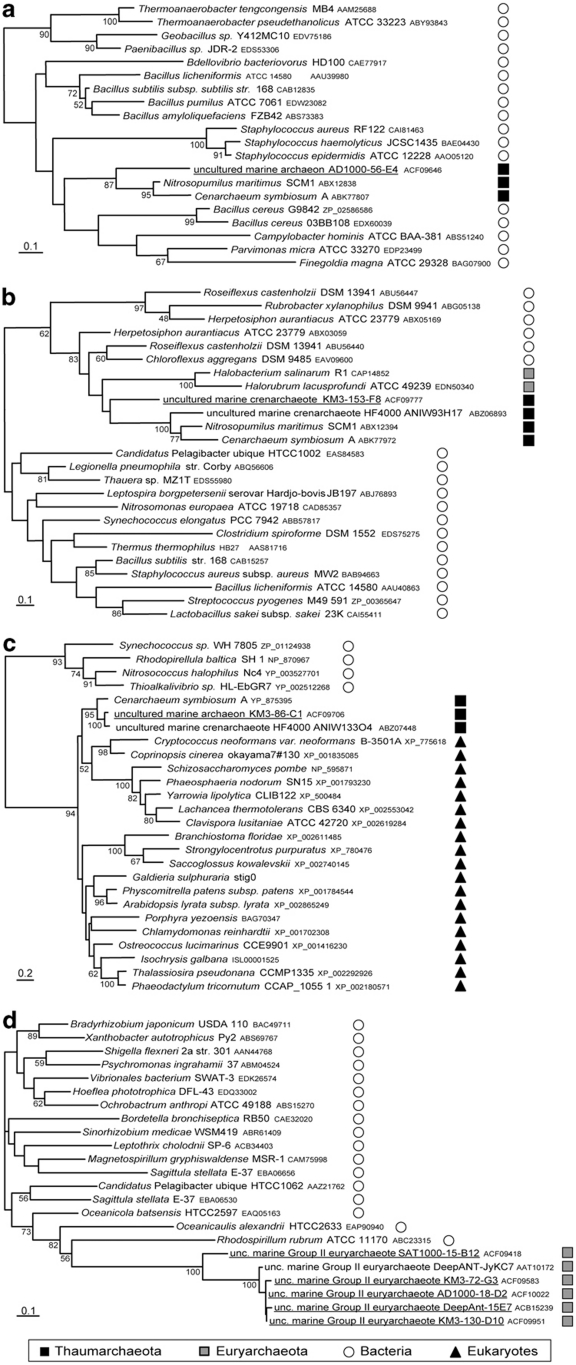
Figure 3.
Maximum likelihood phylogenetic trees illustrating HGT events from diverse donors to Thaumarchaeota and group II Euryarchaeota. (a) HGT from a firmicute donor; (b) HGT from a Chloroflexi donor; (c) HGT from a eukaryotic donor; (d) HGT from a proteobacterial donor. Sequences from our fosmids are underlined. The scale bar represents the average number of substitutions per site. Numbers at nodes correspond to bootstrap values (only those >50% are shown).

