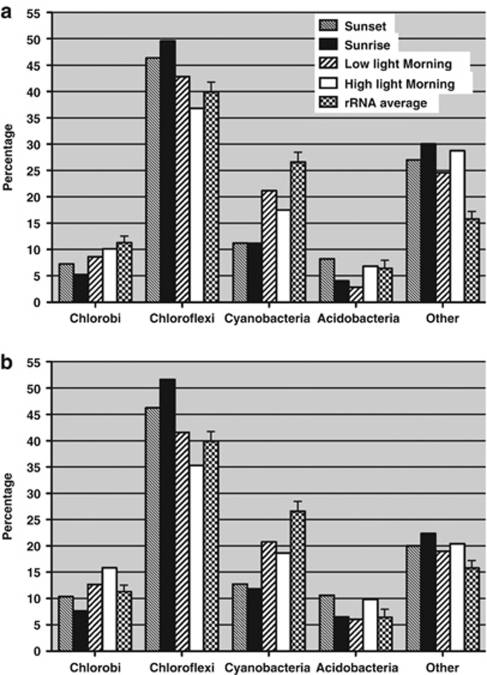
Figure 3.
Composition of mRNA sequences at the kingdom level (major organisms only) in both data sets, pyrosequencing (a) and SOLiD-3 (b) compared with respective average rRNA sequence percentages. Mean±s.d. is shown for rRNA sequence percentages for all four samples. mRNA sequences of seven predominant phototrophic phylogenetic groups and functional guilds are counted. Percentages were calculated based on total mRNA sequences aligned to reference metagenome.

