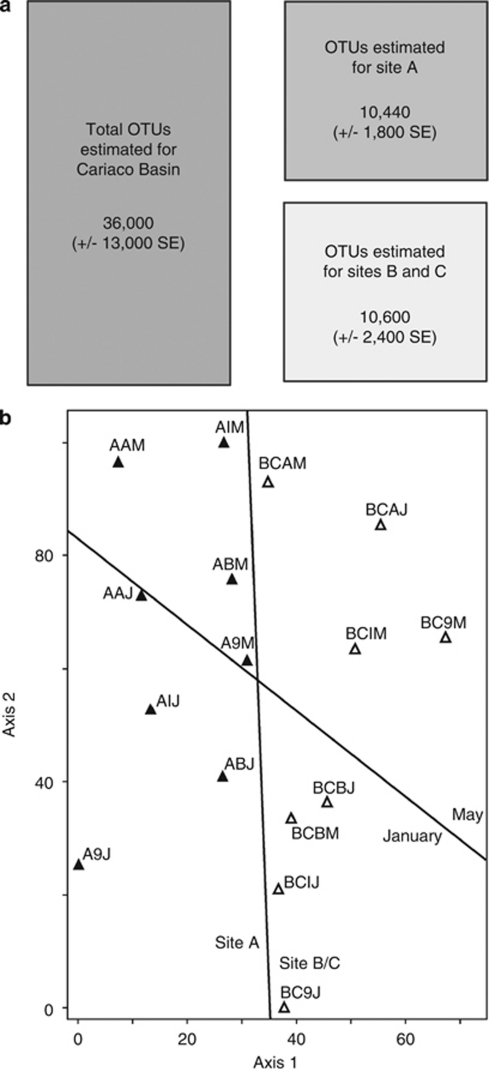
Figure 3.
(a) Predicted richness of protistan assemblages in two different geographic locations with in the Cariaco Basin compared with that predicted for the entire basin. (b) Non-metric multidimensional scaling (NMS) ordination of our 18S rRNA data set clustered at the 95% sequence identity level. Triangles represent the 16 samples taken; white and black triangles correspond to combined samples from sites B and C, and site A, respectively. A sample name ending in M or J (that is BCIM, AIJ and so on) corresponds to May and January samples, respectively. Lines are drawn onto the biplot to separate samples that cluster together.

