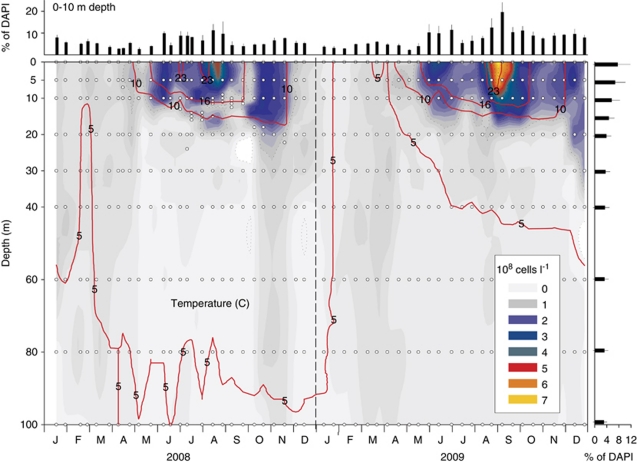
Figure 3.
Spatio-temporal distribution of LD12 bacteria in Lake Zurich, Switzerland. The red lines indicate temperature isopleths and open circles refer to sampling points. Mean proportions and s.d. of LD12 from 0 to 10 m depths are shown on top and mean seasonal values for all depths on the right (in % of DAPI-stained particles).

