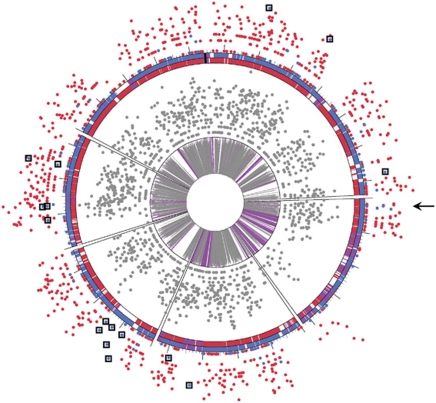
Figure 1.
PIGT analysis of Leptospirillum group II in laboratory proteomic datasets. Unique peptides from all three proteomic replicates were plotted onto aligned genomic representations of Leptospirillum group II 5-way CG (red ring) and UBA (blue ring) genomic variants. Purple loci represent regions of 100% amino acid identity, black represents the CRISPR repeat region, and loci for which a homolog does not exist are white. Large tick marks are spaced 100 genes apart. The inner gray ring represents percent amino acid identity between orthologs (indicated by height of tick marks, purple regions equivalent to 100% identical). Gray spots surrounding the inner ring are the total number of peptides detected at each loci. Spots on the outside of the diagram represent the number of unique peptides detected at each loci (red=Type I, blue=Type VI). Unique peptides are plotted on a log2 scale, with higher placement indicating higher detection. The arrow indicates a region of unique Type VI peptides consistently detected in the otherwise Type I dominated laboratory genotype. This region likely represents a small recombinant block. Boxes surround other abundant Type VI peptides that lack a Type I orthologue in the 5-way CG genomic dataset (and thus probably represent Type I peptides). The color reproduction of this figure is available on the html full text version of the manuscript.

