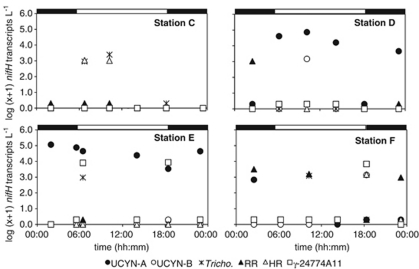
Figure 3.
Diel expression of cyanobacterial and proteobacterial nifH gene expression determined using RT-qPCR at Stations C–F. Sample C5 has been omitted from these plots owing to discrepancies in T/S. Bars at the top of each graph indicate night time (black) and daytime (white). If nifH transcripts per l were measured as DNQs, they were conservatively estimated to be 1 nifH transcript per l.Tricho.—Trichodesmium; RR—Richelia associated with Rhizosolenia; HR—Richelia associated with Hemiaulus.

