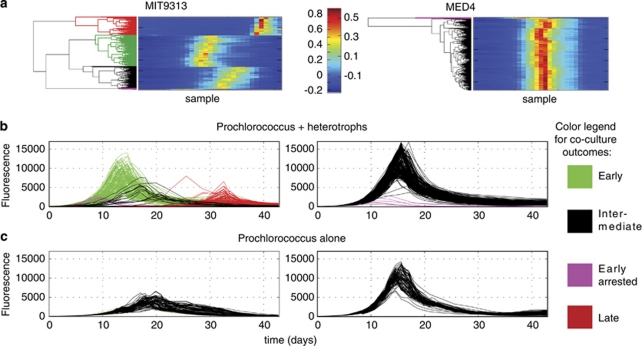
Figure 1.
Features of Prochlorococcus MED4 and MIT9313 growth patterns in response to co-culture with 250 different strains of heterotrophic bacteria. (a) Heat maps of the normalized FL of all 338 growth curves (250 co-cultures and 88 controls) as clustered using hierarchical clustering (HC). A clearly different pattern can be seen between four major clusters in MIT9313 but only two in MED4. (b, c) FL curves of the 250 co-cultures (b) and 88 axenic Prochlorococcus cultures (c). The curves are colored as shown in the legend based on the clustering results in panel (a). Four different types of curves, which differ in their growth timing and maximal FL, can be observed for MIT9313, whereas only two clusters are observed for MED4. Note the similarity in the shape of the ‘early arrested' outcome between MIT9313 and MED4.

