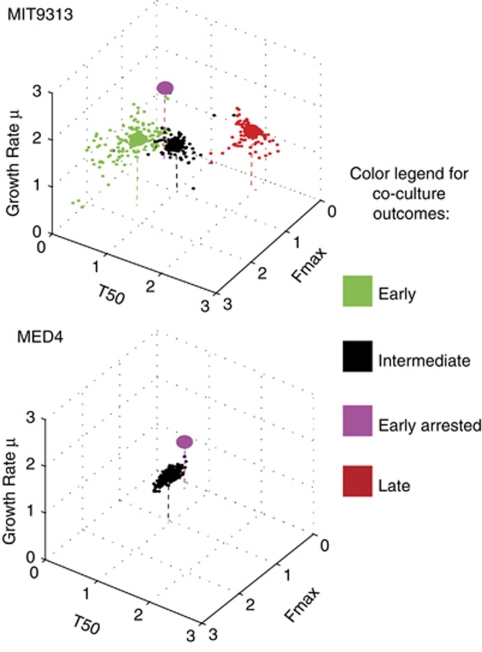
Figure 2.
The quantitative three-dimensional parameter spaces defining the effect co-culture on Prochlorococcus MIT9313 and MED4. A three-dimensional parameter space is shown, with the axes being the maximum growth rate (μ), the time it took the cultures to reach half of the maximal FL (T50), and the maximum FL (Fmax). The parameter spaces shown includes both the co-cultures and the control axenic cultures, and are normalized to axenic wells on the same plates (that is, values larger than one represent an increase in the relevant parameter compared with axenic culture, smaller than one represent a decrease). The data points are colored based on the clustering shown in Figure 1. Large circles represent the median coordinates of each co-culture outcome.

