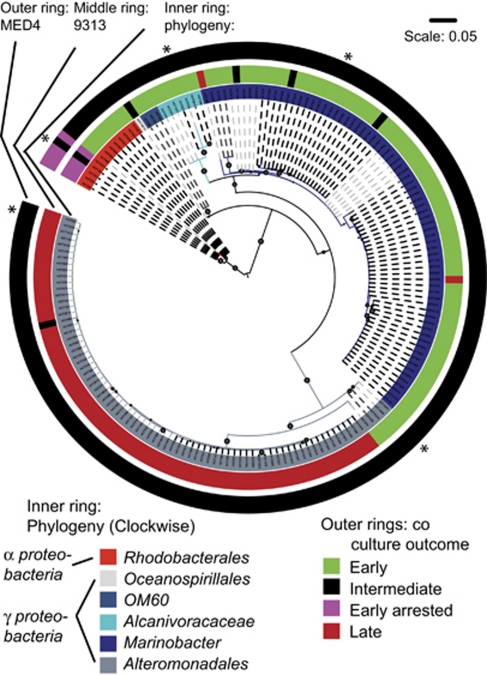
Figure 3.
The relationship between patterns observed in co-cultures and the ribotype of the heterotroph. A maximum likelihood (ML) tree (partial 16S rDNA sequences) is shown, with the co-culture outcome (as defined in Figure 1) shown for MIT9313 (middle ring) and MED4 (outer ring). Spheres on the tree branches denote >80% approximate Likelihood Ratio Test (aLRT) confidence (Anisimova and Gascuel, 2006). Different shading of the branches of the tree denotes operational taxonomic units (OTUs) at 0.01 resolution (see also Supplementary Figure 1 and Supplementary Table 1). Asterisks denote the phylogenetic position of strains used for the experiments shown in Figure 4.

