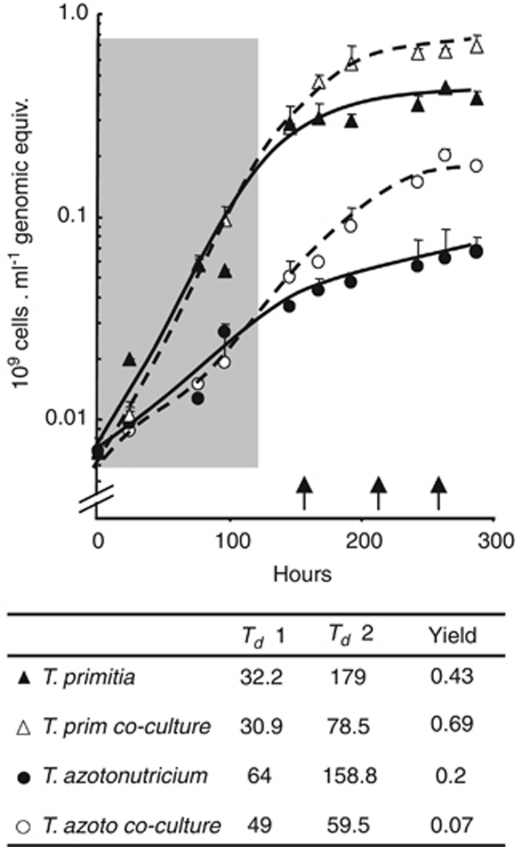
Figure 1.
Synergistic growth effects in co-culture of termite-gut treponemes. Quantitative PCR measurements are given for T. primitia and T. azotonutricium abundance in either pure culture (solid lines) or co-culture (dashed lines). The growth phase in which bacteria in both pure cultures and co-cultures grow at roughly equal rates is marked by a shaded box. RNA-sequencing samples were taken at approximately 160 hours (co-culture), 210 h (T. primitia) and 260 h (T. azotonutricium). These collection times are in the later growth phase and are marked by arrows on the X axis. Samples were run in triplicates, and the s.d. is denoted by error bars. Growth rates and yield of each sample are summarized below the curve. Yields are in number of genomic equivalents per ml. Doubling times were calculated from data points either within the first 117 h of growth (Td1) or within the productive stage of growth that proceeds (Td2).

