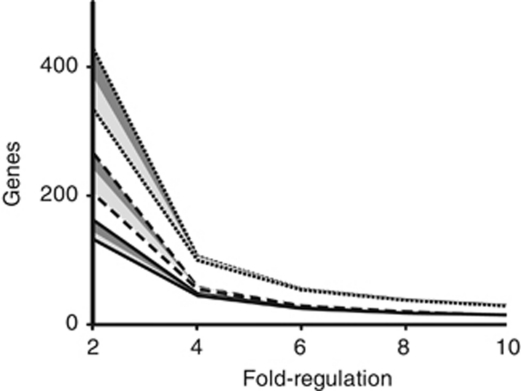
Figure 3.
The expression of a large number of genes in both bacterial species is effected by co-culturing. The number of genes with expression levels regulated by twofold, fourfold, sixfold, eightfold and 10-fold (X axis) plotted for T. primitia (solid lines), T. azotonutricium (dashed line) and both species (dotted line). Best-fit lines were added to aid in data visualization. The area below the dark-shaded box shows the number of genes that are on average twofold regulated, and also have three of the four possible biological replicate combinations above 1.7-fold regulated. The values below the light gray shade are genes that are on average twofold regulated, and in which all four biological replicate combinations are above 1.7-fold regulated.

