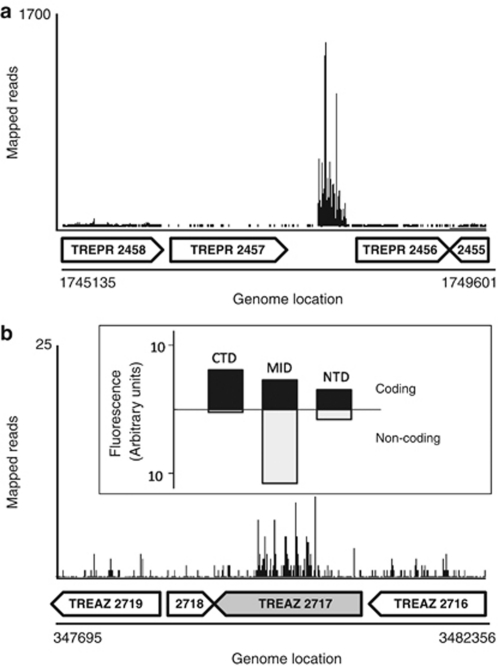
Figure 5.
Transcription mapping of intergenic and atypical transcripts. (a) A graphical representation of transcripts mapped onto an annotated portion of the T. primitia genome containing one of several identified intergenic transcripts in this study. The sequence is similar to that of a tmRNA. Anotated genes are displayed as block arrows below the mapped reads. (b) An atypical transcript pattern in a putative glycohydrolase gene of T. azotonutricium (TREAZ 2717, shaded block arrow) shows a high transcript density in the gene center with repetitive pattern. Data from qRT-PCR experiments differentiating coding (black bars) from antisense (white bars) are shown in the inset box, and correspond to the section of the gene analyzed. qRT-PCR was performed with direction-specific primers in the amino-terminal domain (NTD), central portion (MID), and carboxy-terminal domain (CTD) of the gene.

