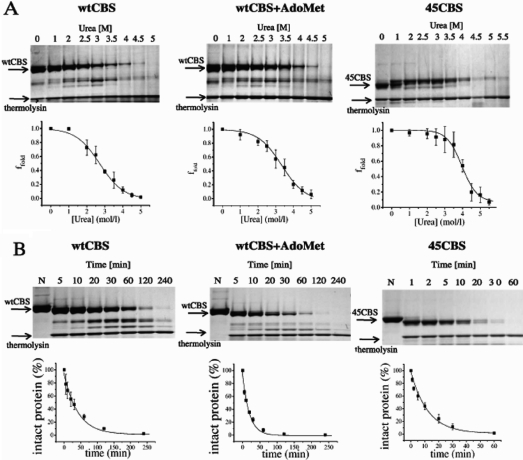
Figure 1.
Pulse proteolysis in urea gradient (A) and proteolytic kinetics by thermolysin under native conditions (B) of CBS proteins. Below the representative SDS−PAGE gels, the corresponding plots are shown. Points are depicted as a mean with standard deviations; curves were fitted by nonlinear regression. (A) Molar concentration of urea for proteolytic pulse is indicated at the top of each line at the gels. Ffold values which represent fraction of remaining intact protein after the proteolytic pulse are plotted against urea concentration. (B) Portion of remaining protein is plotted against the incubation time. Each line of the gels is marked by designed time point of proteolysis in minutes; “N” refers to uncleaved control.

