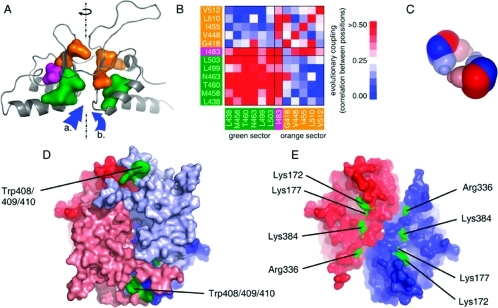
Figure 3.
Computational modeling of CBS structure. (A) Model of C-terminal domain generated by homology modeling. Reliability of the built structure was assessed by protein sector analysis. Each sector is depicted by its particular color (green and orange, respectively); residue I483, coupled in both sectors, is indicated in magenta. The dashed line indicates the axis of pseudo-2-fold symmetry of the subunit; arrows show the potential binding sites for AdoMet. (B) Statistical coupling between sector residues. It illustrates that these positions in the structure of the autoregulatory domain are strongly coupled within each sector but loosely coupled between the two sectors. Colors of the sectors are consistent with panel A. (C) Scheme of tetrameric assembly in CBS using available structural data. Dimer−dimer interface is located between the autoinhibitory domains. Dimers of catalytic core are colored in dark color, autoinhibitory modules are depicted in light colors. (D) Structural model of dimeric wtCBS. Position of differentially reactive cluster W408/9/10 is indicated in green. Each subunit is depicted in particular color, red and blue, respectively. Autoinhibitory module is colored in light colors; catalytic core is depicted darkly. (E) Differentially reactive residues located in crystal structure of 45CBS, indicated in green. Each subunit in dimer is colored in blue and red, respective.

