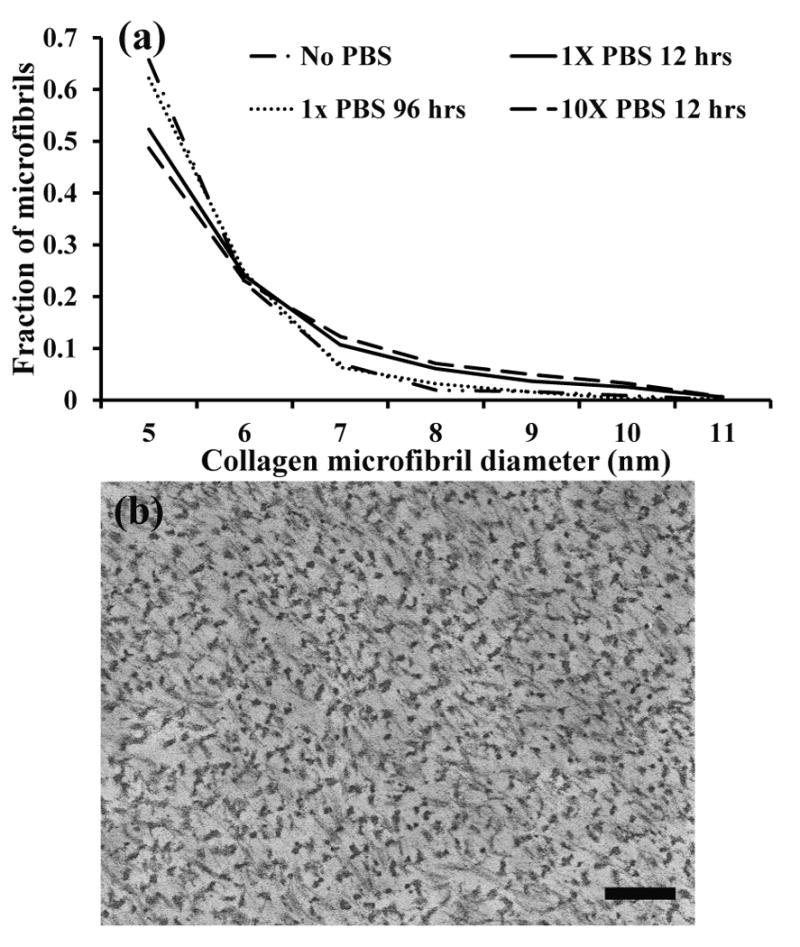
Figure 5.

a) Distribution of collagen microfibril diameters of ELAC threads incubated in different PBS-treatment combinations. A Kolmogorov-Smirnov test indicates that all distributions are statistically similar (p>0.05). b) Representative TEM image of the cross sections of ELAC threads incubated at different PBS-treatment combinations. Throughout the groups, the microfibril distribution was not statistically different (p>0.05). Scale bar represents 200 nm.
