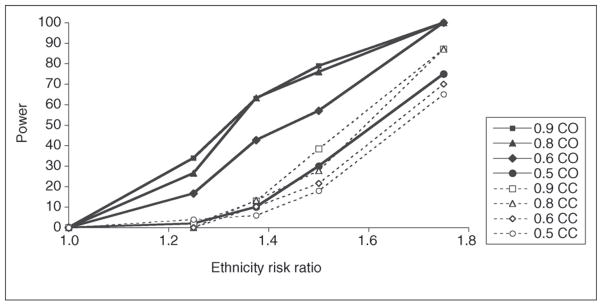
Figure 1.
Power of admixture mapping as a function of admixture mapping information. The power was determined from simulations using 700 cases and 700 controls and SNP sets with admixture information corresponding to the key for the SNP set used [8••]. The power curves shown were determined by using the AdmixMap program and deCODE genetic map for either case-only (CO) or case–control (CC) analyses. The appropriate α level for these analyses, based on extensive simulations, was a normalized score of 4.0. The results were obtained from a minimum of 50 separate simulations and analysis of each measurement. Similar results were obtained with AncestryMap and MALDsoft algorithms in more limited analyses (data not shown). Figure reproduced, with permission, from study by Tian et al. [8••].

