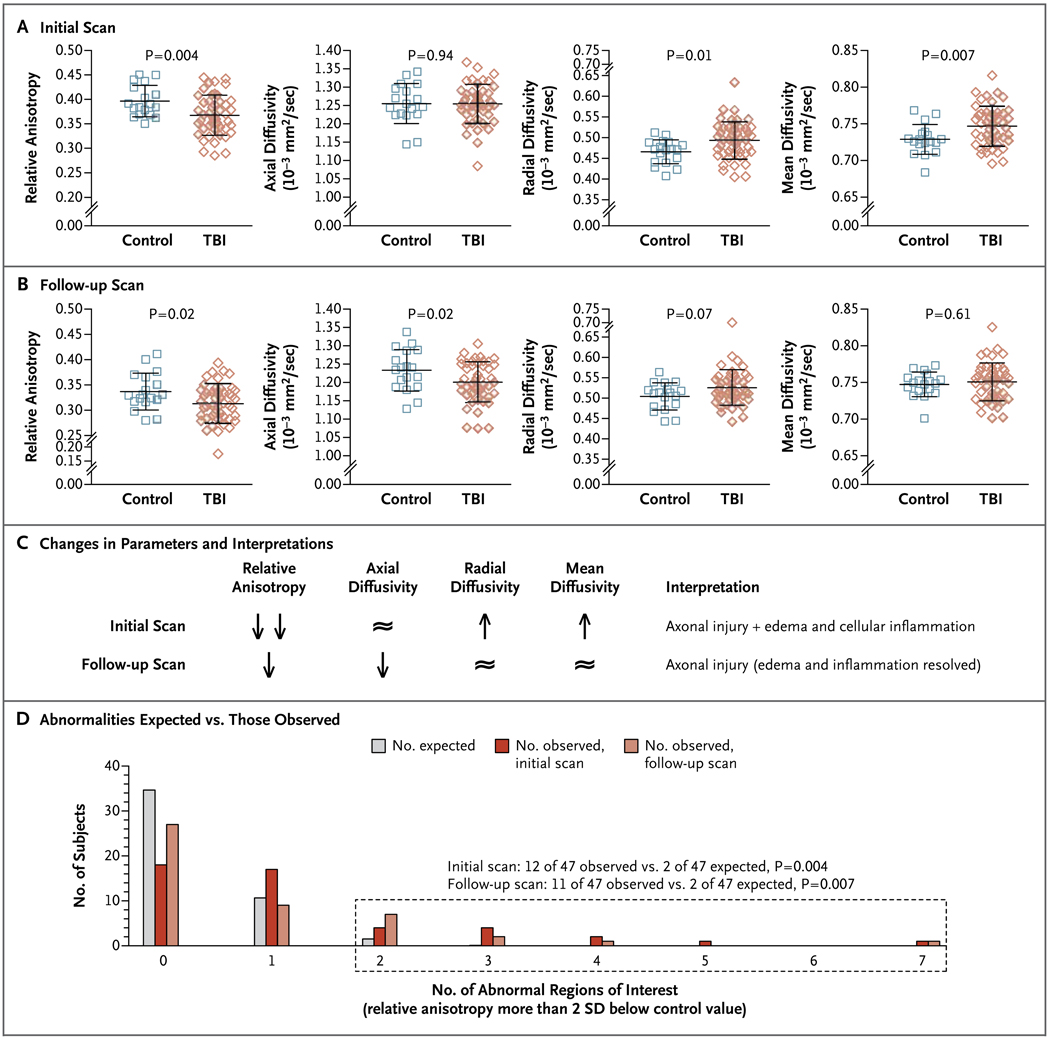
Figure 4. Evolution of Abnormalities over Time as Assessed with Diffusion Tensor Imaging.
All data in Panels A through D are from the 18 controls and 47 subjects with traumatic brain injury (TBI) who underwent both initial and follow-up diffusion tensor imaging (DTI). The formulas for calculating relative anisotropy, axial diffusivity, radial diffusivity, and mean diffusivity are available in Figure S1 and S8 in the Supplementary Appendix. In Panels A and B, the longer horizontal lines indicate the means and the I bars indicate standard deviations. Panel A shows the results of the initial scans (obtained within 90 days after injury) in the cingulum bundles, with reduced relative anisotropy, increased radial diffusivity, and increased mean diffusivity in the subjects with TBI as compared with the controls. Panel B shows the follow-up scans (obtained 6 to 12 months after study enrollment) in the cingulum bundles, with reduced relative anisotropy and reduced axial diffusivity. Panel C shows the changes in DTI parameters between initial and follow-up scanning in subjects with TBI as compared with controls and the interpretation of these changes (see also Fig. S4 in the Supplementary Appendix). The double arrows indicate more extensive reduction in relative anisotropy; the ≈ symbol indicates that there was no significant difference between subjects with TBI and controls. Panel D shows differences in observed versus expected DTI abnormalities on initial and follow-up scans in the 47 subjects with TBI. The dotted box indicates the group of subjects with two or more abnormal regions of interest.

