
Figure 3.
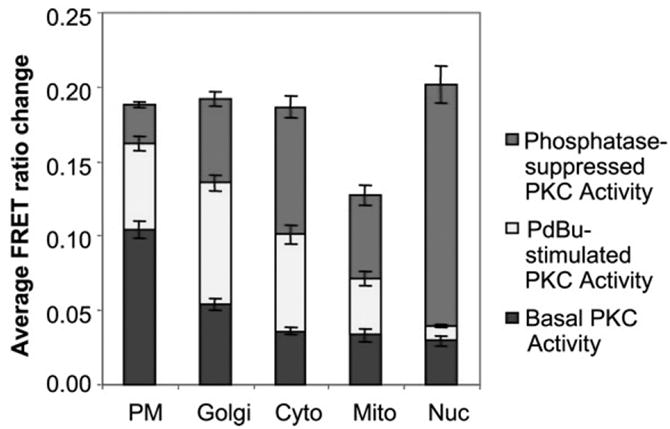
Quantitation of the basal, stimulated, and phosphatase-suppressed PKC activities at specific regions, showing the range of the C Kinase Activity Reporter (CKAR) at each cellular location. The reporter has a consistent maximal range (20% FRET ratio change) at plasma membrane (PM), Golgi, cytosol and nucleus, but a reduced range at the outer membrane of mitochondria. (Figure from Gallegos et al., 2006).