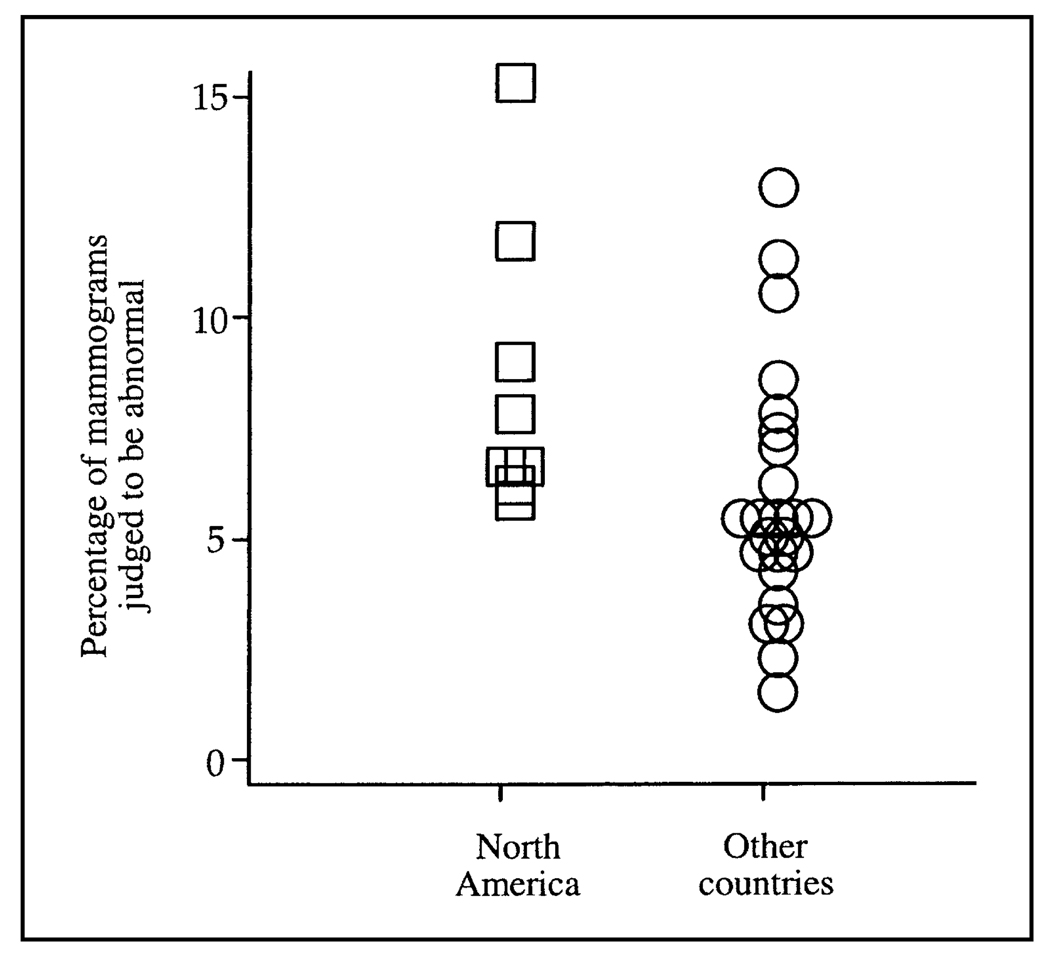
Fig. 1.
Percentage of mammograms judged to be abnormal from published studies by screening program location. North American screening programs (n = 8) are shown as open squares, and programs from other countries (n = 24) are shown as open circles. The weighted mean percentage of mammograms judged to be abnormal was statistically significantly higher in North American programs than it was in programs from other countries (8.4% versus 5.6%; difference in weighted mean percentage = 2.8%, 95% confidence interval = 0.5% to 5.1%; P = .018).

