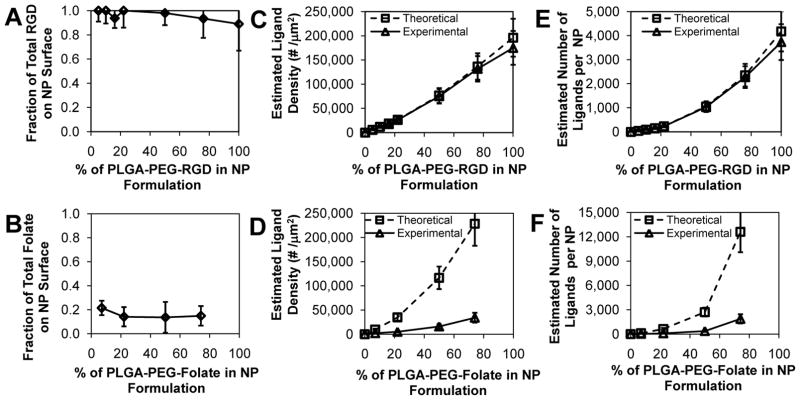
Figure 3.
Quantification of targeted NP surface composition. (A) Fraction of initial RGD that resulted on the NP surface. (B) Fraction of initial folate that resulted on the NP surface. (C) Estimated ligand Densities and (E) estimated number of ligands per NP of NP-RGD as a function of the percentage of PLGA-PEG-RGD in formulation. (D) Estimated ligand Densities and (F) estimated number of ligands per NP of NP-Folate as a function of the percentage of PLGA-PEG-Folate in formulation. Theoretical (□) and experimental (Δ). Error bars represent standard deviation in n = 8 samples for NP-RGD and n = 4 samples for NP-Folate.

