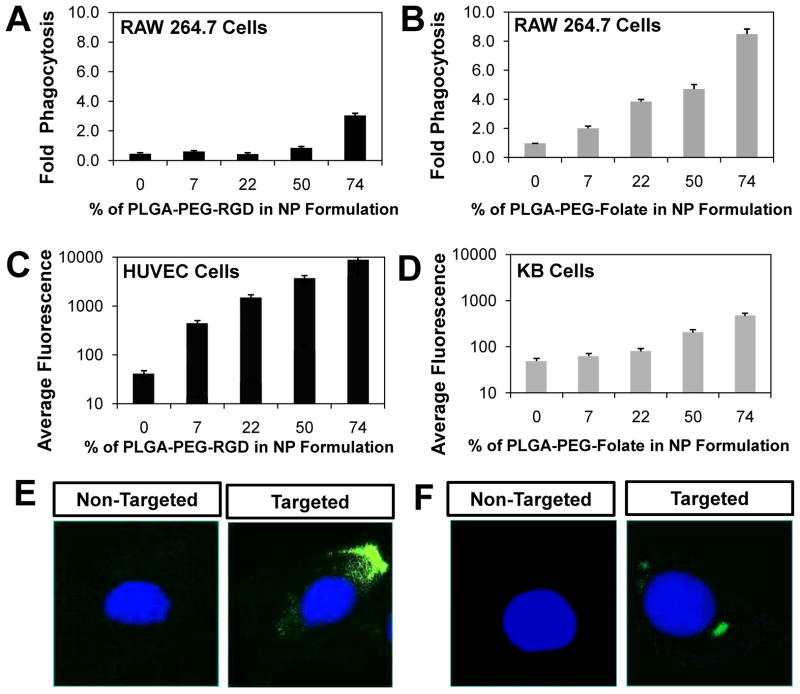
Figure 4.
Cellular binding and uptake of targeted NPs as a function of % of functionalized PLGA-PEG added in the NP formulation. (A) RGD targeted PLGA-PEG NPs and (B) Folate-targeted PLGA-PEG NPs. (C) Association of NP-RGD with HUVEC cells. (D) Association of NP-Folate with KB cells. (E) Representative images of non-targeted and NP-RGD (at 50% of PLGA-PEG-RGD) uptake by HUVEC cells. (F) Representative images of non-targeted and NP-Folate (at 50% PLGA-PEG-Folate) uptake by KB cells. Error bars represent standard deviation in n = 3 samples.

