
Figure 2.
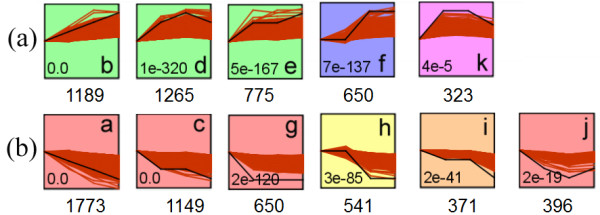
Significant expression profiles. Statistically significant pathways (a to k) are categorized into two groups: (a) up-regulated profiles (b) down-regulated profiles. Numbers of probe sets assigned to each profile are represented below. P-values are shown in left bottom of each profiles, only statistically significant (P-value < 0.05) expression profiles are shown (profiles were produced using STEM software).