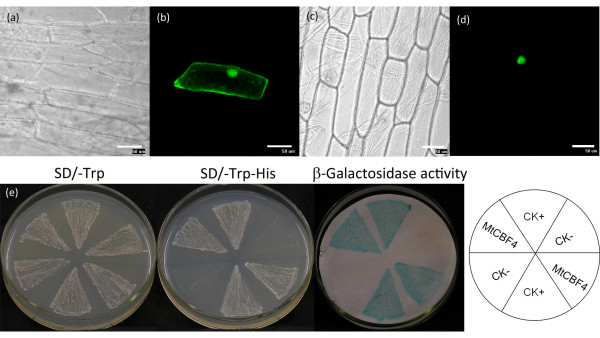
Figure 5.
Subcellular localization and transcriptional activation analysis of MtCBF4. MtCBF4:GFP was bombarded into onion epidermal cells with DNA-coated gold particles, and GFP expression was visualized after 16 h. Cells expressing GFP were used as a control. Images represent GFP alone (b) and MtCBF4-GFP (d) in onion epidermal cells with corresponding bright-field images (a and c). Growth of pBD GAL4-MtCBF4 and pGAL4 transformants on SD/-Trp-His medium and the blue color in the β-galactosidase assay indicated MtCBF4 exhibits transactivation activity (e). The pBD GAL4 empty vector was used as the negative control, and pGAL4 vector was used as the positive control. All of the transformants grew well on SD/-Trp medium. Bars = 50 μm.

