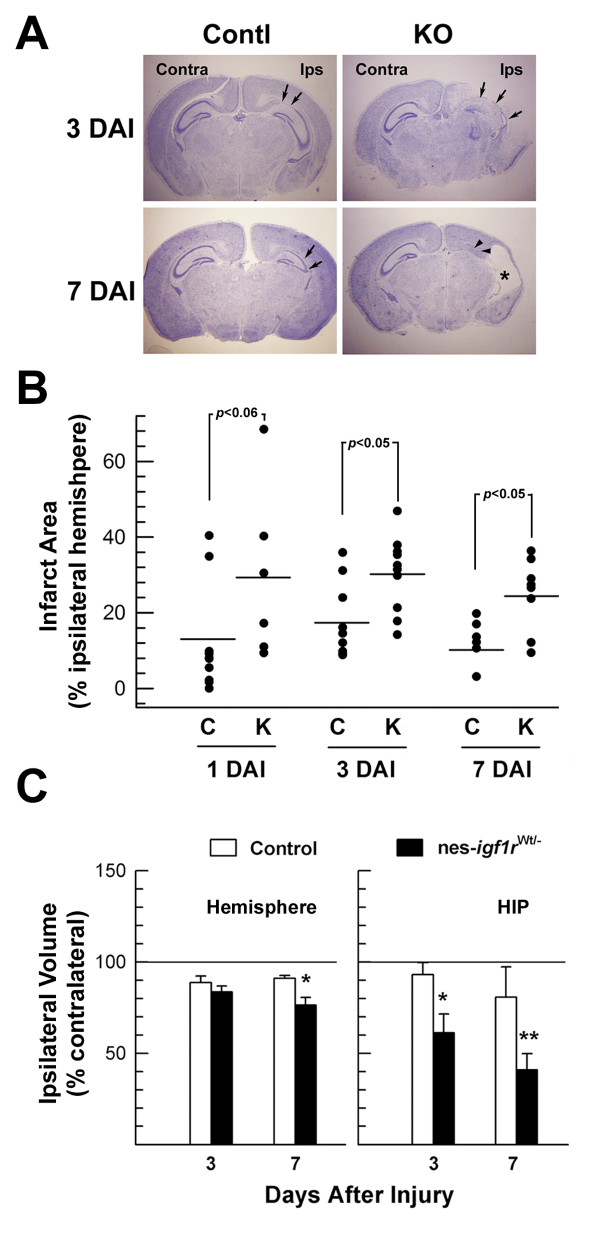
Figure 3.
Increased infarct size and reduced hemisphere volume in injured nes-igf1r-/Wtmice. Paraffin-embedded brains were serially sectioned and stereologically analyzed as described in Methods. A. Representative Cresyl Violet staining of brain sections from a nes-igf1r-/Wt mouse (KO) and its littermate control (Contl) at 3 and 7 DAI, respectively. B. Infarct size. The area of infarct in the ipsilateral hemisphere is expressed as a percentage of the ipsilateral hemisphere area. Each dot represents the value from an individual mouse. Values represent mean ± SE from 6 - 10 brains in each group. C. Quantification of hemisphere and hippocampus volume. Hemisphere and hippocampus volume is expressed as percentage of contralateral counterparts. Values represent mean ± SE from 5 - 8 brains in each group. *, p < 0.05; **, p < 0.01, compared to control mice.

