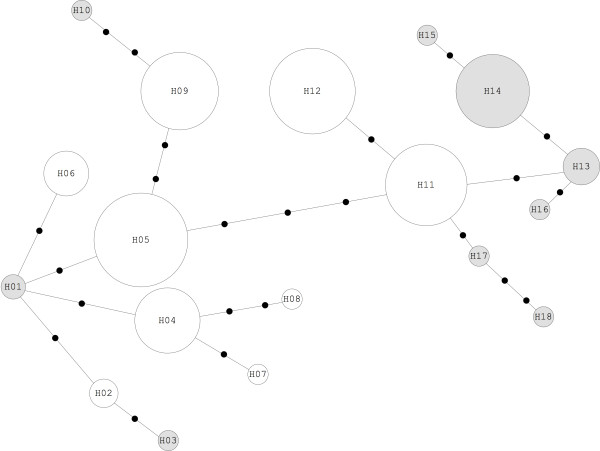
Figure 5.
Statistical parsimony network. 18 haplotypes of An. darlingi populations for ND4 mitochondrial fragments. Black dots along the lines indicate mutational steps between haplotypes (unrepresented in the sample). The size of the sphere is proportional to the number of individuals carrying the haplotype.

