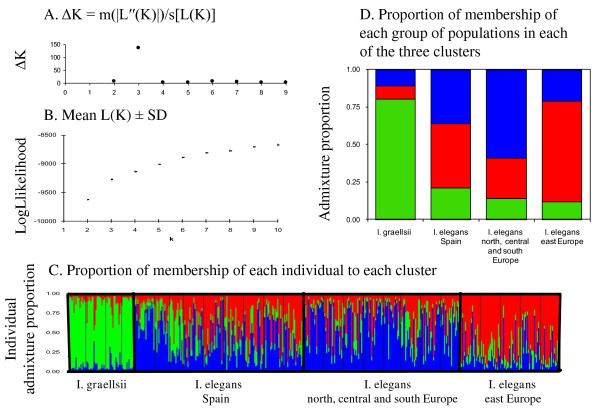
Figure 4.
Estimated population structure of I. elegans from Bayesian structure analyses using the program STRUCTURE. 4.A. ΔK-values for different K; suggesting K = 3 as the most likely structure (ΔK = m|L"(K)|/s[L(K)]; see [67]. 4.B. Mean likelihood (± SD) of K for different numbers of clusters, K. 4.C. Individual Bayesian assignment probabilities for K = 3 for 22 populations of I. elegans and 4 I. graellsii populations. Individuals are represented by thin vertical lines, which are partitioned into K shaded segments representing each individual's estimated membership fraction. The black lines separate sampling sites. 4.D. The average Bayesian assignment probabilities for K = 3 for the four geographical areas; (1) eastern Europe, (2) northern, central and southern Europe, (3) Spanish I. elegans populations, and (4) I. graellsii populations.

