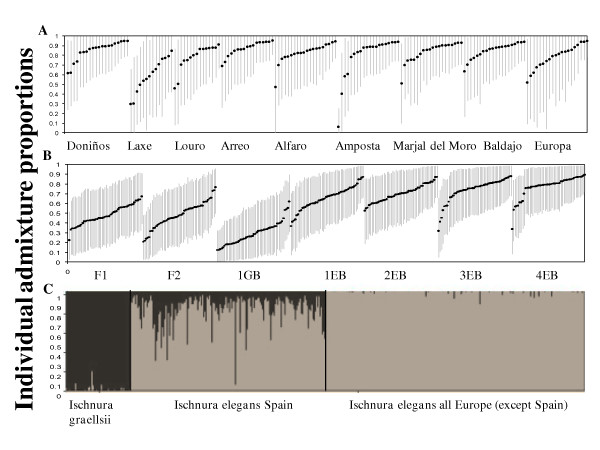
Figure 5.
Admixture analysis in STRUCTURE. A and B panels show the admixture analysis in STRUCTURE of 166 genotypes of nine Spanish populations of I. elegans (upper panel) and for the artificial hybrids genotypes generated with the program HYBRID-LAB (mid panel). The estimated admixture proportion of each individual is represented by the mean assignment (± 90% credible intervals) to the I. elegans cluster. C panel shows admixture proportions of all 472 I. elegans and I. graellsii genotypes. Each individual is represented by a single vertical line broken into two segments which are proportional to the estimated membership in each of the two genetic clusters (Q1 for I. graellsii (black), and Q2 for I. elegans (grey)).

