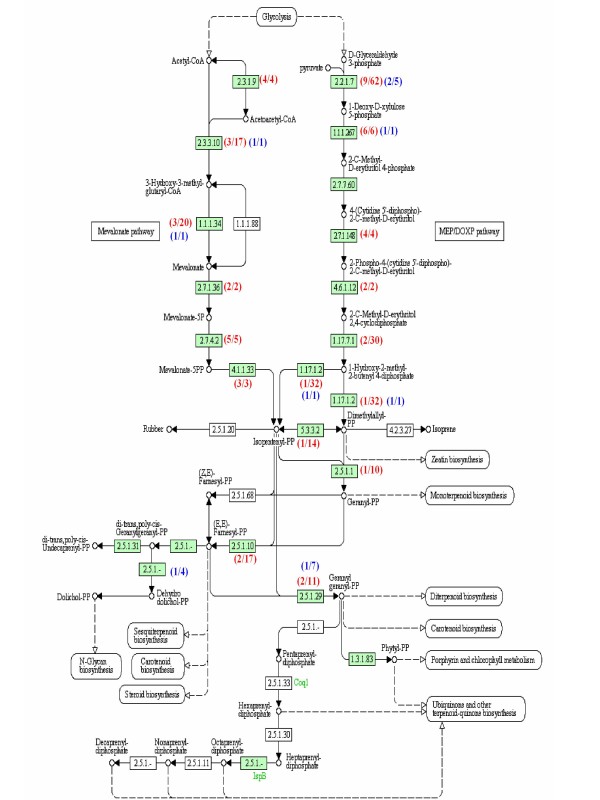
Figure 6.
Graphic representation of terpenoid backbone biosynthesis pathways, including cytosolic mevolonate pathway and plastic methylerythritol phosphate pathway, for Phalaenopsis orchids. The red and blue numbers represent the ESTs generated by this study and derived from P. bellina [16], respectively, that are homologous to genes involved in the terpenoid backbone biosynthesis pathway. The first number in the bracket is the number of unigenes corresponding to the catalytic gene in the pathway, and the second number is the number of reads for the unigene.

