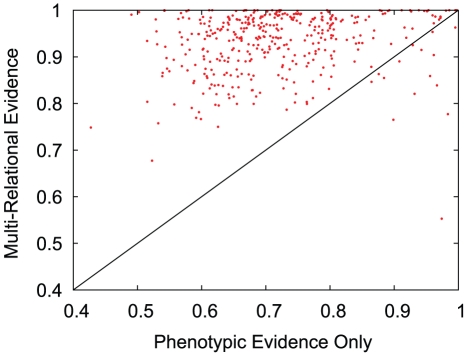
Figure 7. Link predictor performance by individual disease.
Area under the receiver operating curve (AUROC) comparison of link predictor performance for each unique disease. The experiments were hold-one-out, where all genetic associations of the testing disease were removed. The x axis shows the performance of Adamic/Adar on the phenotypic data only, and the y axis is the performance using the MRLP on the multi-relational network. Each point which falls above the diagonal indicates that multi-relational evidence improved link prediction performance for the corresponding disease.

