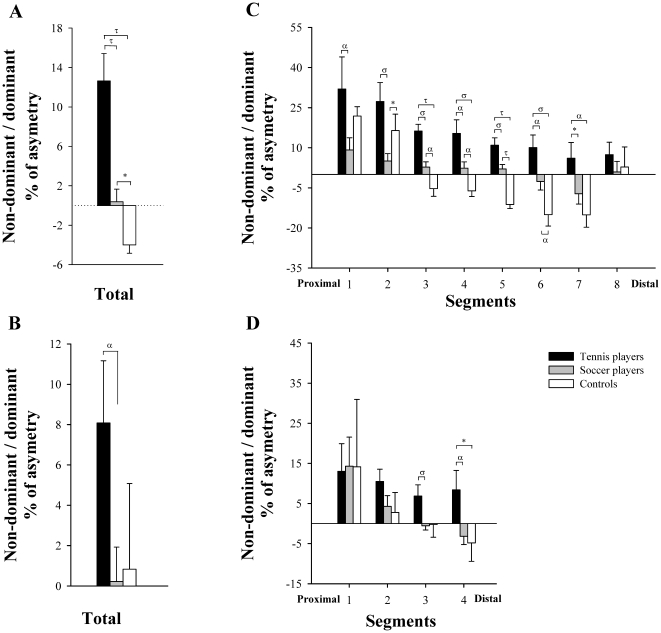
Figure 3. Differences between tennis players, soccer players and non-athletes in the percentage of asymmetry of iliopsoas and gluteal muscles.
Percentage of asymmetry in total volume of iliopsoas (A) and gluteal muscles (B); Percentage of asymmetry in CSA, segment by segment, of iliopsoas (C) and gluteal muscles (D). α P<0.05, σ P<0.01, τ P<0.001, * P = 0.06.

