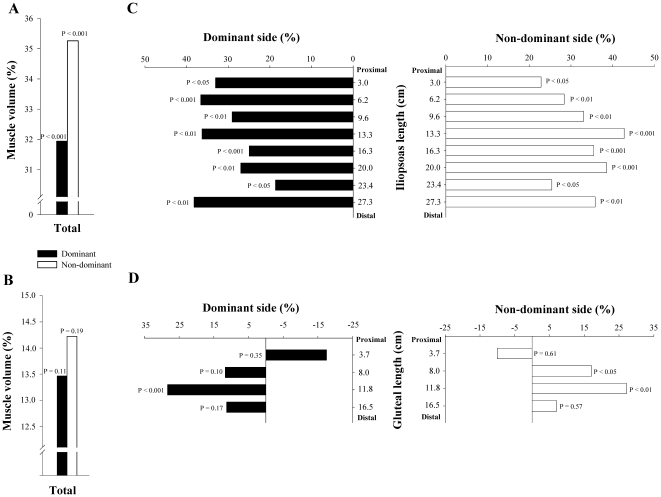
Figure 4. Differences in total volume and CSA (segment by segment), expressed in percentage, between soccer players and non-athletes.
Difference in total volume of dominant and non-dominant iliopsoas (A) and gluteal muscles (B); Difference in CSA, segment by segment, of dominant and non-dominant iliopsoas (C) and gluteal muscles (D). All comparisons are adjusted for the length of the corresponding muscle, age and BMI.

