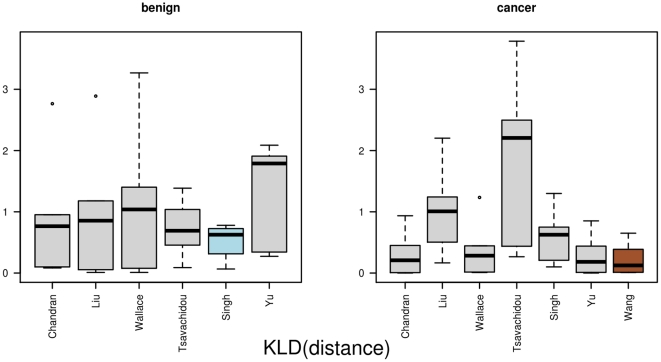
Figure 6. The results for KLD(distance).
This figure displays the distances between the networks as boxplots. The distances are based on the distribution of distances between vertices and the Kullback-Leibler divergence. In the left part are the distances between the benign networks, and in the right part the distances between the cancer networks.

