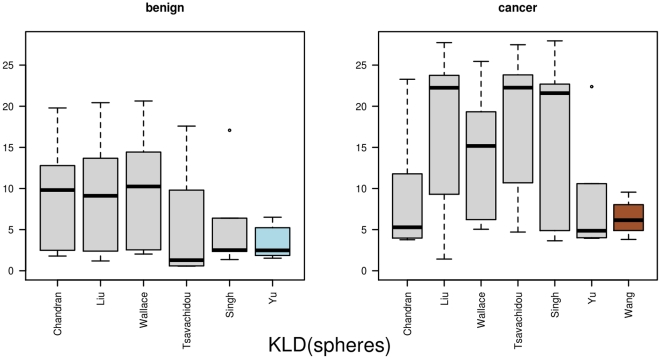
Figure 7. The results for KLD(spheres).
Here, we display the distances based on the Kullback-Leibler divergence, based on the sphere vertex functionals. In the left part we show the benign samples and in the right part the distances for the cancer samples. The selected graph prototypes are highlighted.

