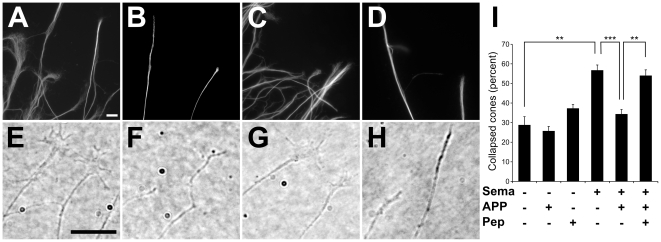
Figure 3. sAPPα modulates the biological activity of Sema3A.
Growth cone morphology was examined in control chick DRG explants (A,E) and in explants challenged for 30 minutes with 0.8 nM Sema3A (B,F), Sema3A+75 nM sAPPα695 (C,G) or Sema3A+sAPPα695+75 nM each of peptides ARSHPAM and LTASLLI (D,H). After fixation and neurofilament immunostaining, growth cone morphology was examined using fluorescence (upper panels) or phase contrast microscopy (lower panels). Scale bars: 10 µm. Representative images (A–H) illustrate on average two growth cones, but more than 700 growth cones were evaluated in each experimental condition. Panel I shows results of quantitative analysis of the percentage of collapsed growth cones (as determined from phase contrast images) in each experimental condition. Bars correspond to means ± SEM of different ganglia. Each experimental condition was replicated 3–6 times in independent experiments using different DRG cultures. Asterisks represent statistically significant differences (**p<0.01; ***p<0.001; ANOVA followed by Bonferroni post-hoc test).

