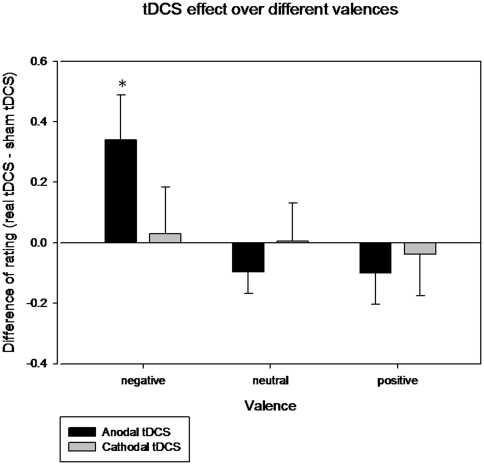
Figure 3. Changes induced by real tDCS in the scores of emotional evaluations compared to sham tDCS.
The values correspond to the mean change of rating between sham and real tDCS (and standard errors of mean), both anodal and cathodal, for each valence category. Only ratings for the negative emotional pictures under anodal left DLPFC were significantly different from sham (* p = 0.036, see table 3).

