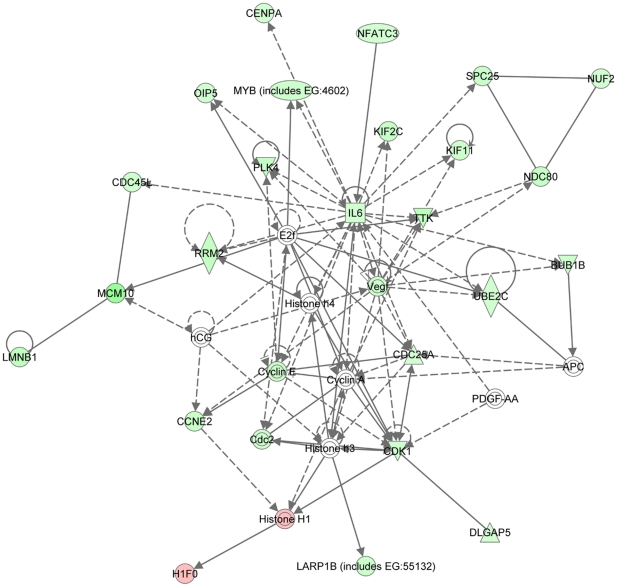
Figure 6. Network analysis of ANGPT2-induced changes in myoblast transcriptome.
The top network of regulated genes in human myoblasts infected with Ad-ANGPT2 viruses vs. cells infected with Ad-GFP viruses (control condition). This figure was created with the Ingenuity Pathway Analysis system. Upregulated genes are shown in red while downregulated genes are shown in green. Color intensity indicates the degree of change in gene expression. White nodes are genes whose expression was not significantly changed in cells infected with Ad-ANGPT2 viruses vs. Ad-GFP viruses. Arrows with plain lines indicate direction interactions, and arrows with interrupted lines represent indirect interactions. Top functions associated with this network include cell cycle, cellular assembly and organization, DNA replication, recombination and repair.

