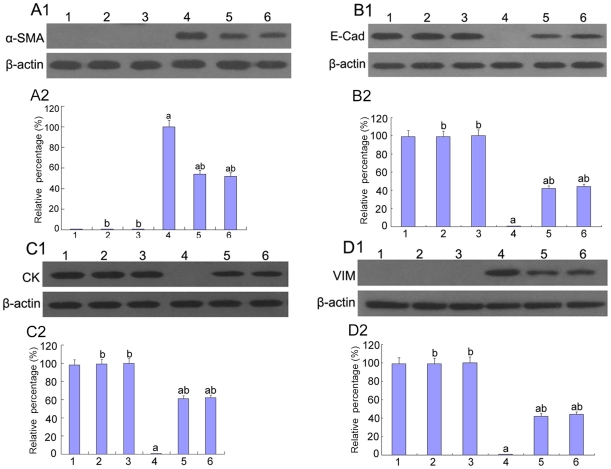
Figure 8. Expression of E-cadherin, CK, α-SMA, vimentin in HK-2 cells by Western blot.
(A)α-SMA, (B)E-caderin, (C)CK, (D)vimentin were measured by Western blot of the HK-2 cells cultured in 5.5 mM glucose (lane 1), 5.5 mM glucose with p38 siRNA (lane 2), 5.5 mM glucose with AP-1 inhibitor (lane 3), 5.5 mM glucose+TGF-β1 (10 ng/ml) (lane 4), 5.5 mM glucose+TGF-β1(10 ng/ml) with p38 siRNA (lane 5), 5.5 mM glucose+TGF-β1(10 ng/ml) with the AP-1 inhibitor (lane 6). aP<0.05 vs. 5.5 mM glucose, bP<0.05 vs. 5.5 mM glucose+TGF-β1.

