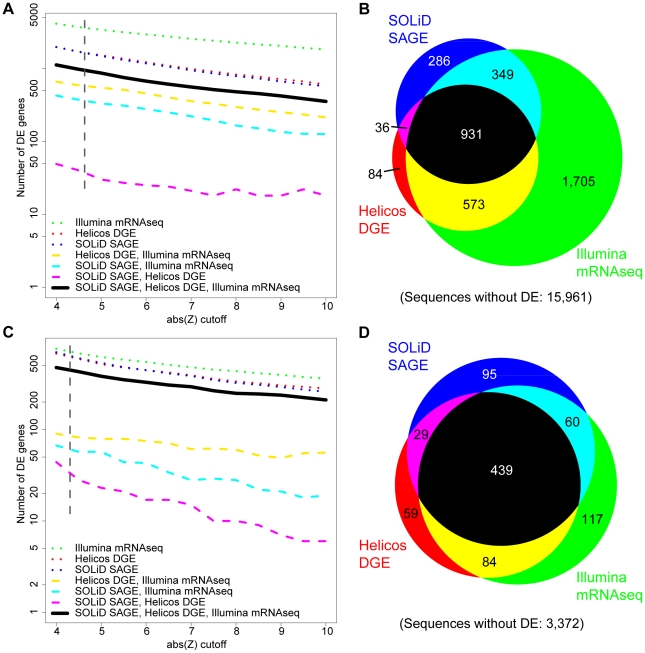
Figure 3. The number and overlap across platforms of reference sequences identified to have differential expression (DE).
Analyses of all reference sequences (A, B) and analyses of the subset of sequences with the 3′-most NlaIII site (C, D). (A, C) The effect of the Z threshold on the number of genes found to have differential gene expression. The relatively flat lines in all cases indicate little sensitivity to Z threshold. (B) Proportional Venn diagram of the number of sequences with significant differential expression (Z>4.71) in analyses of all reference sequences. (D) Proportional Venn diagram of the number of sequences with significant differential expression (Z>4.38) in analyses of the subset of sequences with the primary tag site. Areas in Venn diagrams are approximate. Dashed lines in A,C indicate Z-values used in B, D. The same color code applies to all figures.

