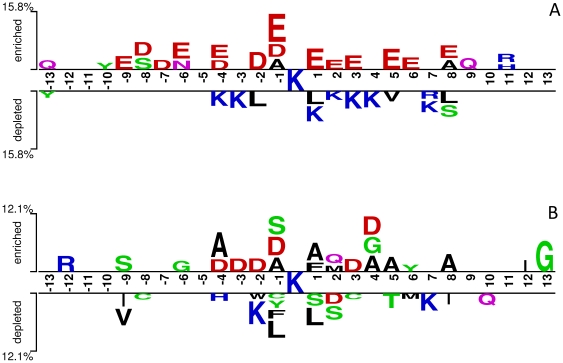
Figure 3. Two Two-Sample-Logos of the position-specific residue composition surrounding the ubiquitination sites and non-ubiquitination sites, which were inferred from Radivojac_dataset (A) and Cai_dataset_1 (B), respectively.
These two logos were prepared using the web server http://www.twosamplelogo.org/ and only residues significantly enriched and depleted surrounding ubiquitination sites (t-test, P<0.05) are shown.

