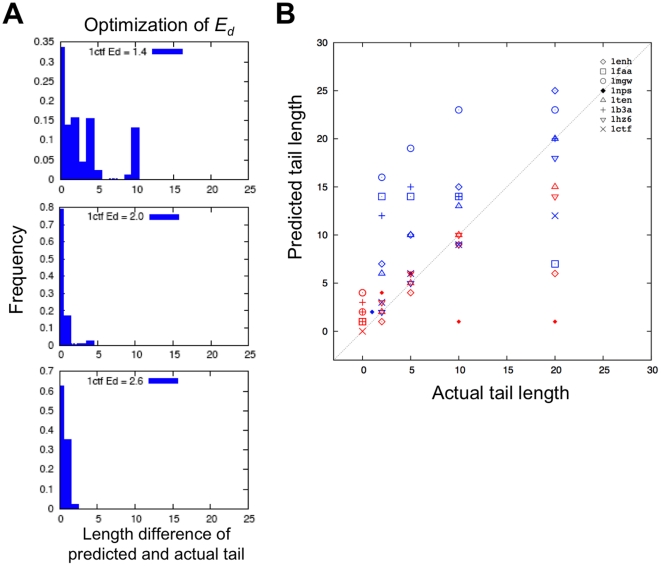
Figure 1. Results of disordered termini prediction.
(A) Optimization of Ed value using 1ctf from the test set as a representative example. In panel 1 to 3, histograms show the accuracy of prediction results using representative of Ed values, where the x-axis shows the length difference of predicted and actual tail, and the y-axis shows the frequency of prediction. We show here the prediction results with Ed values of 1.4, 2.0 and 2.6 in panel 1, 2 and 3, respectively. With the Ed value of 2.0, the prediction shows the greatest accuracy, where the predicted length difference equals to zero (the prediction matches the actual length) with the highest frequency of 0.8 (maximum equals to 1). (B) Prediction of disordered terminal regions. Blue and red symbols represent N- and C- terminal tails, respectively. Different symbols corresponds to different test cases; the multiple instances of each symbol type represent the different tail lengths considered for a given test case.

