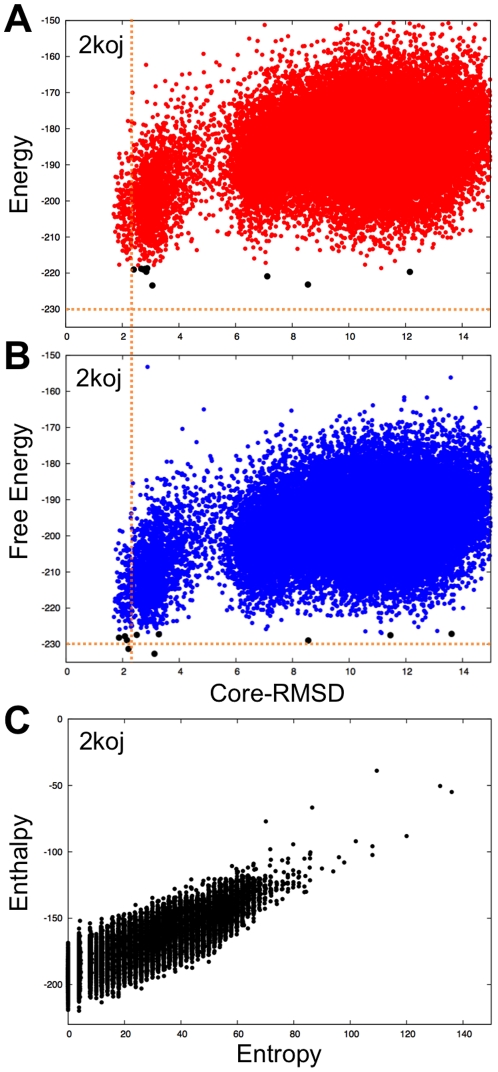
Figure 4. Comparison of energy versus rmsd and free energy versus rmsd plots for case with disordered internal loop (2k0J).
A) Rosetta all atom energy and B) free energy computed using Eq. (1) with predicted disordered regions (Fig 3B-2k0j). The energy shown in A is calculated using the Rosetta all-atom energy. In A and B, the x-axis is the RMSD to the folded portion of the native structure. The 10 lowest energy/free energy decoys are shown in black. The dashed orange lines are provided to aid comparison of the two plots. (C). Compensation between the entropic and energetic contributions to the free energy (Eq. (1)).

