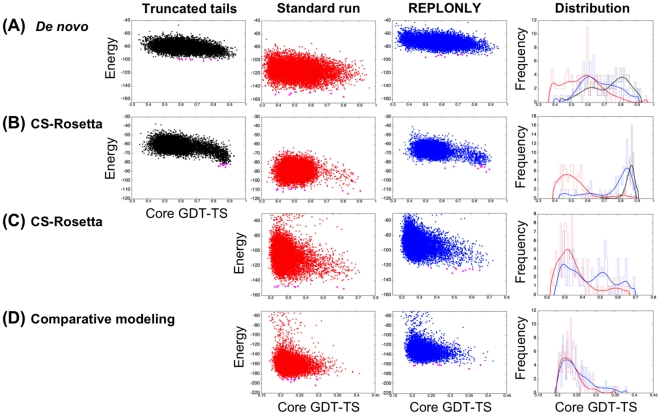
Figure 5. Rosetta modeling with disordered regions treated as REPONLY.
(A) ab initio (1enh). (B) CS-Rosetta (2ae9). (C) CS-Rosetta (2k4n). (D) Comparative modeling (2k4v). Column 1 to 3. Energy versus core GDT-TS plots. In column 1 (Truncated tails) standard Rosetta simulations are carried out with disordered termini removed, in column 2 (Standard run) standard Rosetta simulations are carried out including tails/internal loops and in column 3 (REPLONLY) the disordered regions contribute only repulsive-related energies during Rosetta structure calculations. The GDT-TS values on the x-axis were calculated from the folded portion of native structure (Table 4). Column 4: Histograms of core GDT-TS of the 1% low-energy models. Black line “Truncated tails” calculations, red line “Standard run” calculations, and blue line “REPLONLY” calculations.

