Figure 1.
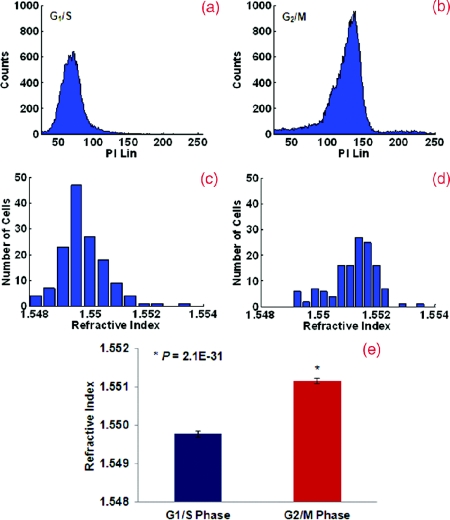
(a) and (b) Flow cytometry and (c) and (d) the corresponding nuclear refractive index histogram of HeLa cells arrested at the G1/S and G2/M phases. (e) Statistical analysis of the refractive index from the cell nuclei. The nuclear refractive index from cells arrested at the G2/M phase (4N DNA content) shows a significant increase compared to those at the G1/S phase (2N DNA content) (P = 2.1E-31). Approximately 150 to 160 cells were analyzed for nuclear refractive index at each phase.

