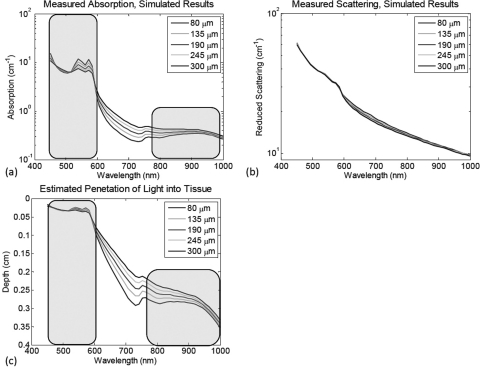
Figure 3.
Simulated results. (a) The resulting absorption spectra from the simulated two layer construct, as processed by a standard homogeneous model based spatial frequency domain algorithm. (b) The resulting reduced scattering spectra from the two layer phantom constructs. (c) The calculated optical penetration depth based off of the wavelength specific determined absorption and reduced scattering values. Highlighted regions indicate the spectral windows used to determine the top layer thickness, per Eq. 5.

